- Best Practices ●
- COVID-19 ●
- Industry Trends ●
- Partners ●
- Product ●
How Does QR Code Tracking Work?
If you’re using QR Codes as a part of a digital marketing campaign, QR Code tracking can help you understand your campaign success rates. In turn, you can use this information to adjust your current campaigns and inform future campaigns.
But how does QR Code tracking actually work, and what are the most important metrics you should be watching? We’ll cover all that and more, so keep reading!
The basics of QR Code tracking
There are two major types of QR Codes: Dynamic QR Codes and Static QR Codes. Each type has different abilities, so the best type to use depends entirely on your end goal. Let’s take a look at the differences.
Trackable: Dynamic QR Codes
Dynamic QR Codes are trackable, meaning you can monitor details about how users interact with them. This includes information like the scan locations, the number of scans, what time the scans took place, and the operating systems of the devices used. You can also distinguish between unique scans and repeat scans by the same user.
Another major advantage of Dynamic QR Codes is that you can edit them at any time. This is, of course, extremely helpful for correcting mistakes in the linked resources or information, as well as fixing any QR Code scanning problems.
However, you may also want to make adjustments to QR Code campaigns while they are running. So we highly recommend using Dynamic QR Codes that allow you to make any necessary changes.
Untrackable: Static QR Codes
The other type of QR Code is a Static QR Code, which is an uneditable and untrackable QR Code. You would typically use this type of QR Code for a Plain Text QR Code, Email QR Code, or SMS QR Code. Static QR Codes are also more suitable for personal use where tracking isn’t important.
Want to learn more about how QR Codes actually work? Check out our guide to QR Code encoding.
What are the benefits of tracking QR Code analytics?
The tracking capabilities of Dynamic QR Codes give digital marketing professionals unique insights into consumer behavior. For example, they can learn which devices their audience prefers to use or what time of day their users typically scan.
You can also measure the performance of campaigns, allowing you to optimize future campaigns and efficiently allocate resources.
For example, giving each ad a unique Dynamic QR Code allows you to count the number of scans for each ad. Number of scans, which tells you whether consumers were compelled enough by the ad to act on it, is a pretty good indicator of whether the ad worked.
You can also use QR Code analytics to A/B test different ad components, such as location, image, copy, or QR Code calls to action. Once you’ve collected scan data from different campaigns, you can use it as a benchmark for overall ad and campaign performance.
What are the most important QR Code metrics?
QR Codes analytics offer meaningful metrics, including device used, location, number of scans, and time period. Let’s take a look at these metrics in detail.
Operating system
The majority of users scan QR Codes with their smartphones—each of which uses a particular operating system, typically Android or iOS. This information reveals which types of phones are popular among your QR Code campaign audience.
Example case: Let’s say that you’re an indie game company that wants to branch out into mobile gaming for the first time. But you want to figure out which operating system most of your audience uses, so you can focus on optimizing your app for that OS.
You could post an ad at a gaming convention with a QR Code. The operating system metrics would provide a clue as to whether gamers interested in your work are more likely to use Android or iOS phones.
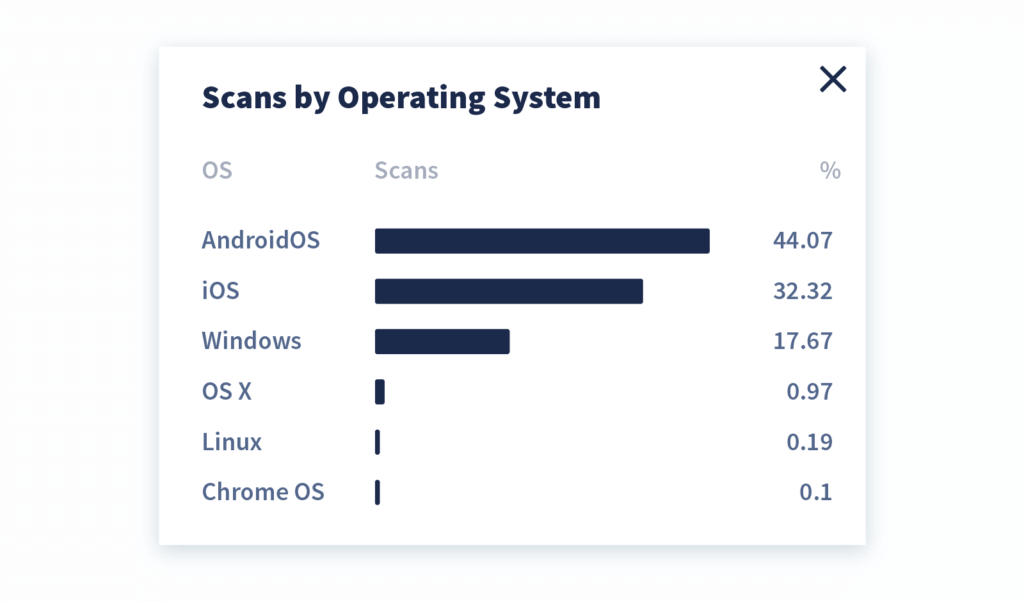
QR Code tracking includes information on the operating system used to scan
Pro tip: Use an App Store QR Code to detect the user’s operating system and link your app landing page to the compatible app store.
Location (city and country)
You can view the location of scans by categories such as country and city, shown with the number of scans as a percentage of the total. This information is based on an individual’s IP address, not a GPS location.
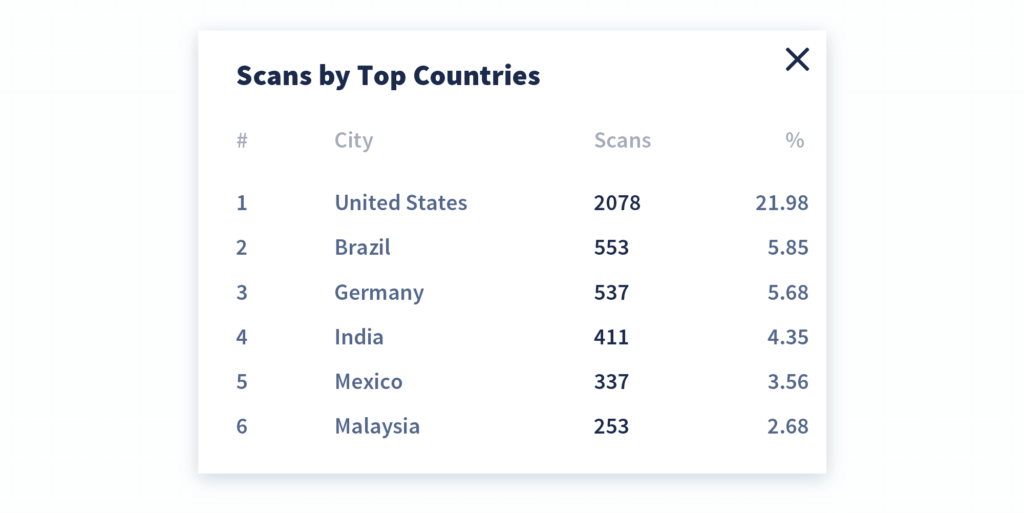
Countries are listed according to their scanned location
Example case: You’re a multinational e-commerce retailer that wants to increase social media engagement, but you aren’t entirely sure which locations will give you the best engagement.
You could use a Social Media QR Code on billboards set in various locations where you’ve had good outreach with previous customers. After implementing the campaign, you can then monitor which countries and even specific cities to re-target with your social media campaigns.
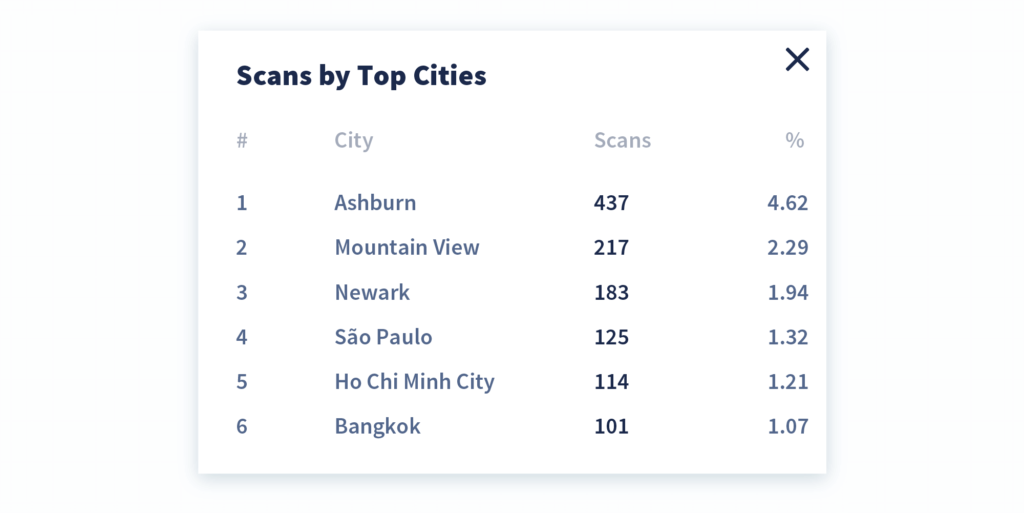
QR Code tracking also includes city metrics
Total number of scans
This metric shows the complete number of times users scanned a QR Code, including multiple scans by a single individual. This information is particularly useful when cross-referenced with other tracking metrics like time period and location.
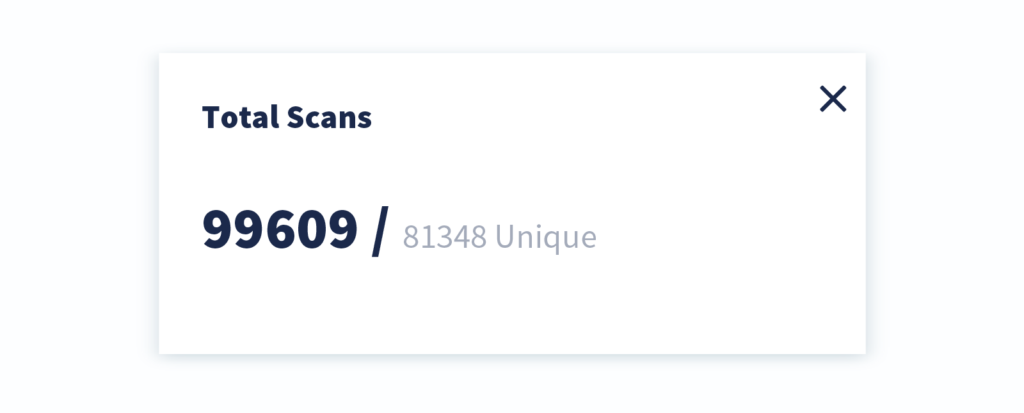
QR Code Generator software counts total and unique scans in real time
Example case: As a caterer, you found that your QR Code ads receive a high number of scans in some months but much fewer in other months. You can use this information to know when to run particular ad campaigns to generate new business.
For example, you could gauge from this metric when to start showing a specific Christmas advertisement to customers looking for holiday catering.
Unique scans
Slightly different from total scans, unique scans are the number of times new users scan a QR Code, tracked by the number of scans per device. So, even if multiple devices share the same IP address, they still count as unique scans.
The total number of scans can, therefore, provide slightly inflated results in comparison to unique scans. Unique scans are an important metric to watch for when you measure conversion rates.
Time period (month, day, hour)
QR Code scanning metrics also break down the scan time into the month, day, and even hour, all shown as live data. This tracking data is extremely useful if you want to compare the success of campaigns over various time periods.
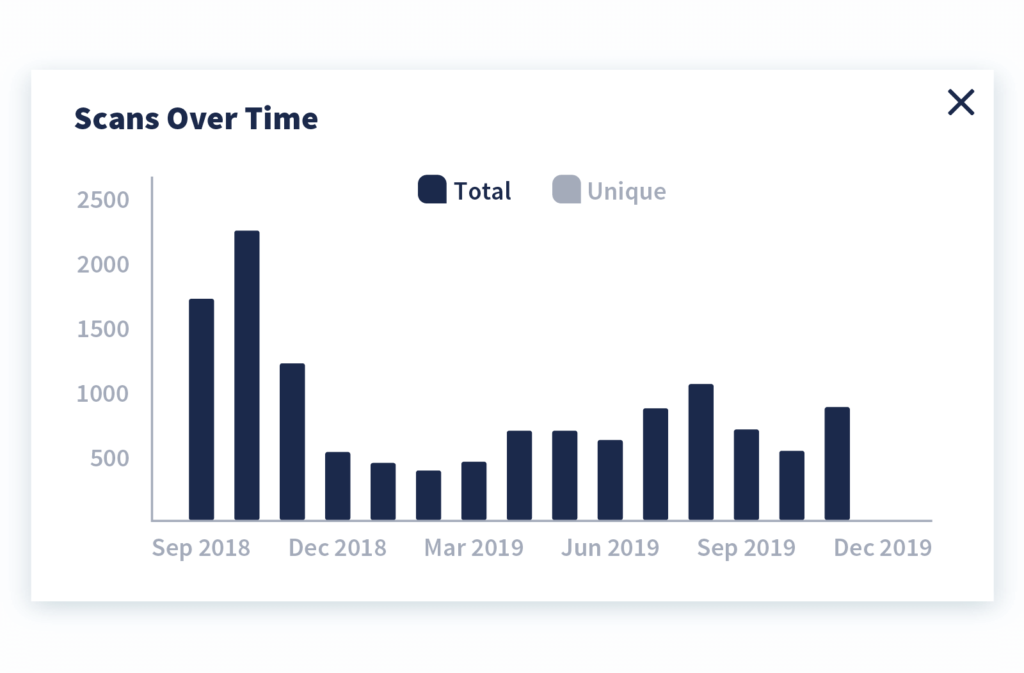
View QR Code scans over a period of time
Example case: You are a real estate agency, and you want to promote certain properties with unique benefits. Real estate agencies tend to have photo displays on their shop fronts, but print displays only show limited information.
You could add a PDF QR Code to a property display where a potential customer can view a lot more information, even outside of office hours. You can compare different displays and listings and see when you have the most foot traffic based on the scan time, then replicate this to increase viewings.
ROI (return on investment)
This metric is one of the most important. ROI is the amount of revenue you earned from your marketing campaign minus the amount of money you spent. However, ROI also more casually describes whether a campaign earned the intended results.
Sometimes, your goal for a particular QR Code marketing campaign will be awareness or engagement, as opposed to bottom-line revenue. QR Code metrics can help you determine if you reached the goals of your campaign by giving you data about user behavior.
Optimizing for ROI takes time and experimentation. You’re one of the lucky ones if you achieve amazing results from your first campaign. Typically, the process involves different levels of testing over long periods of time to obtain the best results, often using a process known as A/B testing.
How to use A/B testing to compare QR Code campaigns
A/B testing is the process of comparing two or more similar marketing campaigns with slight variations to see which one is more effective. If you want to achieve better results from your marketing strategies, but you’re not sure where to begin, A/B testing is a fantastic method to give your campaign direction.
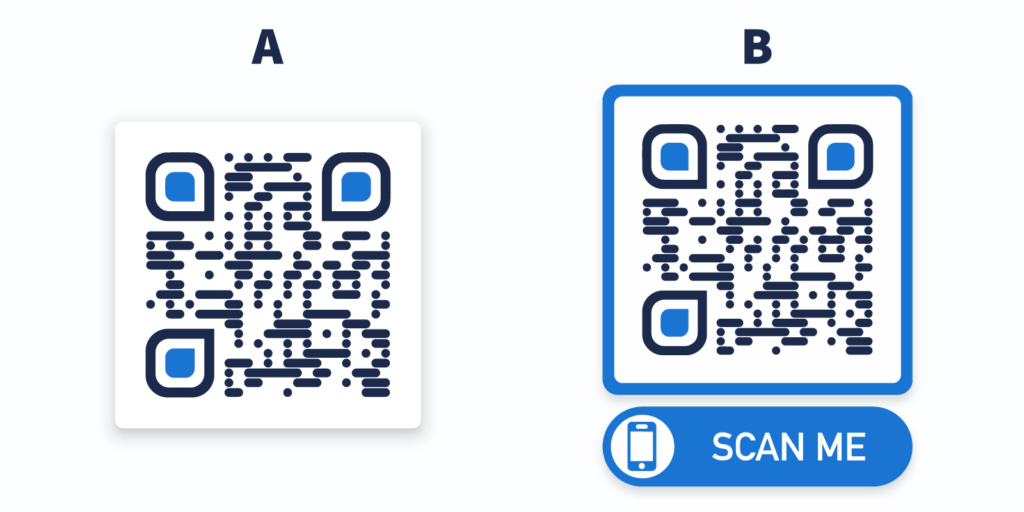
A/B test example of which QR Code will get more scans: with or without a call-to-action frame?
Email marketers and social media advertisers have long used A/B testing to gather key information about the success rates of campaigns. You can compare aspects like different photos, styles of copy, calls to action (CTAs), target demographics, and much more to understand which campaigns are the most successful.
Many “overnight successes” are actually the result of tons of A/B testing over a long period—which finally led to their “aha moment.”
QR Codes allow you to bring this same premise to other types of marketing efforts, such as billboards, product packaging, and subway ads. If you run different versions of a similar ad with, say, different calls to action or images, you can place a unique QR Code on each one.
Comparing the number of scans will allow you to determine which ad was more effective and optimize your future campaigns. Again, A/B testing takes patience and time, so you’ll need to make the commitment to really do proper long-term testing.
How to do QR Code tracking with Google Analytics
QR Code Generator PRO has built a platform designed for easy, intuitive tracking of QR Code data. You can view reports and track the performance of all your campaigns that use QR Codes.
However, it can also be useful to track them with Google Analytics to compare QR Code traffic with other web traffic channels.
To track a QR Code with Google Analytics, you will need to add tracking parameters to the QR Code link—officially called “UTM parameters.” The parameters add extra text to the link, which you can customize to indicate where you used the link.
Use UTM parameters to state that the medium was a QR Code. The final link will look something like this: www.example.com/page?utm_medium=printQRCode. Once you have your link set up, you can use it to generate a QR Code.
Now when someone scans the QR Code, Google will record the UTM parameter text. You’ll be able to view the URL data in your web traffic reports on your Google Analytics account—indicating which traffic came from your lovely QR Code.
Start tracking your QR Code scans in real time today
QR Code data can provide unique insights into user behavior and campaign performance, especially when used with print campaigns. This data can drive further optimization of a variety of marketing channels and help you understand how to engage customers—not just talk to them.
If you’re ready to collect the metrics you need to make data-driven decisions, sign up for QR Code Generator PRO today.